A Cycle of Gratitude and Kindness
*
A Cycle of Gratitude and Kindness *
A Cycle of Gratitude and Kindness (2025)
Illustrator | Photoshop
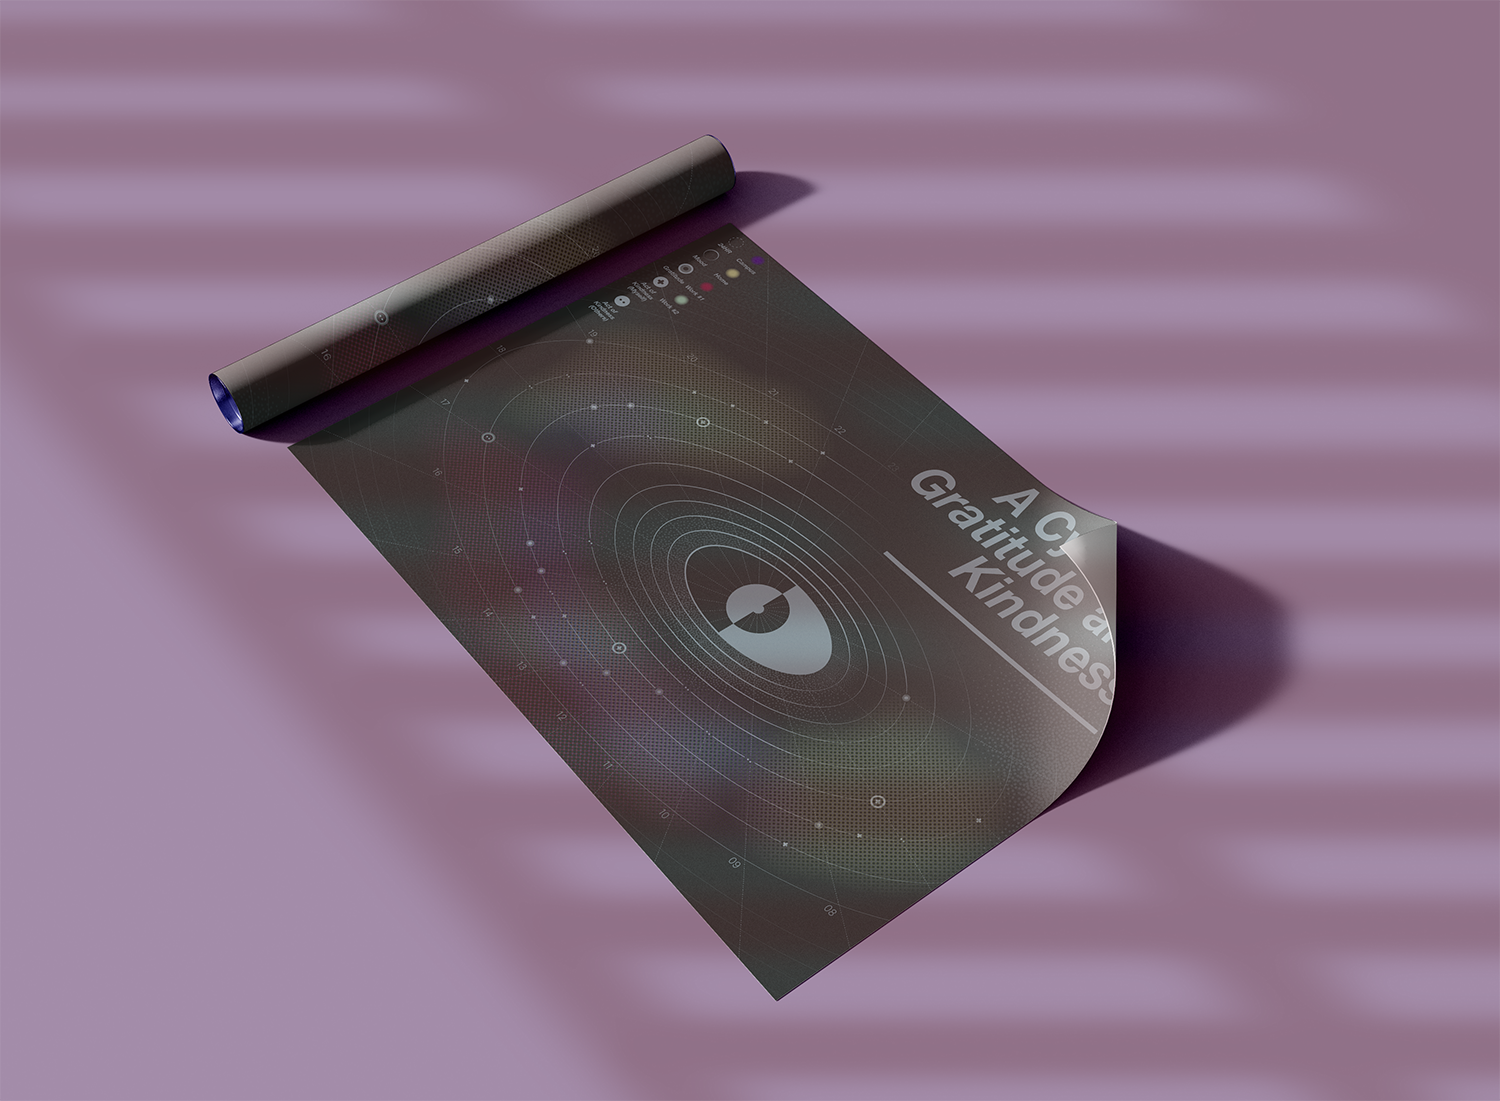
A Cycle of Gratitude and Kindness is a data visualization graphic that maps the patterns of gratitude and kindness in daily life. By tracking when and where specific activities occur most frequently, this visualization reveals meaningful trends in behavior and interaction.
This project reflects on the research, data collection, and data visualization skillsets.
Process
-
I recorded three things I was grateful for and up to three acts of kindness toward others and myself each day for ten days. I used the Google Sheets app from January 20 to 29, entering the data at night or the next morning if I forgot.
-
After collecting and recording the data, I used the Miro board's AI feature to better organize and categorize it. Then, I used an Excel sheet to add missing information, like the motivational level, which I moved from after each activity to the end of the day and renamed it "Mood" level. During analysis, I noticed repeated activities in certain places, expected because of my regular school and work routine, so I removed or combined many duplicate entries.
-
After talking with my professor, I realized I needed to explore more shapes for this visualization. I tried ovals, circles, rectangles, diamonds, and others. During the group critique, I was told I was showing too much at once. Although that was my plan, I soon understood my visualization wasn’t the best for my goal. So, I changed direction. Instead of focusing on location, I focused on time, showing 24 hours and using a simple graphic to highlight when activities happen most. This idea led to the current visualization, similar to my original idea but with a new focus and clearer message. I also redesigned the symbols, which will be explained in the final work description.
FINAL DELIVERABLE
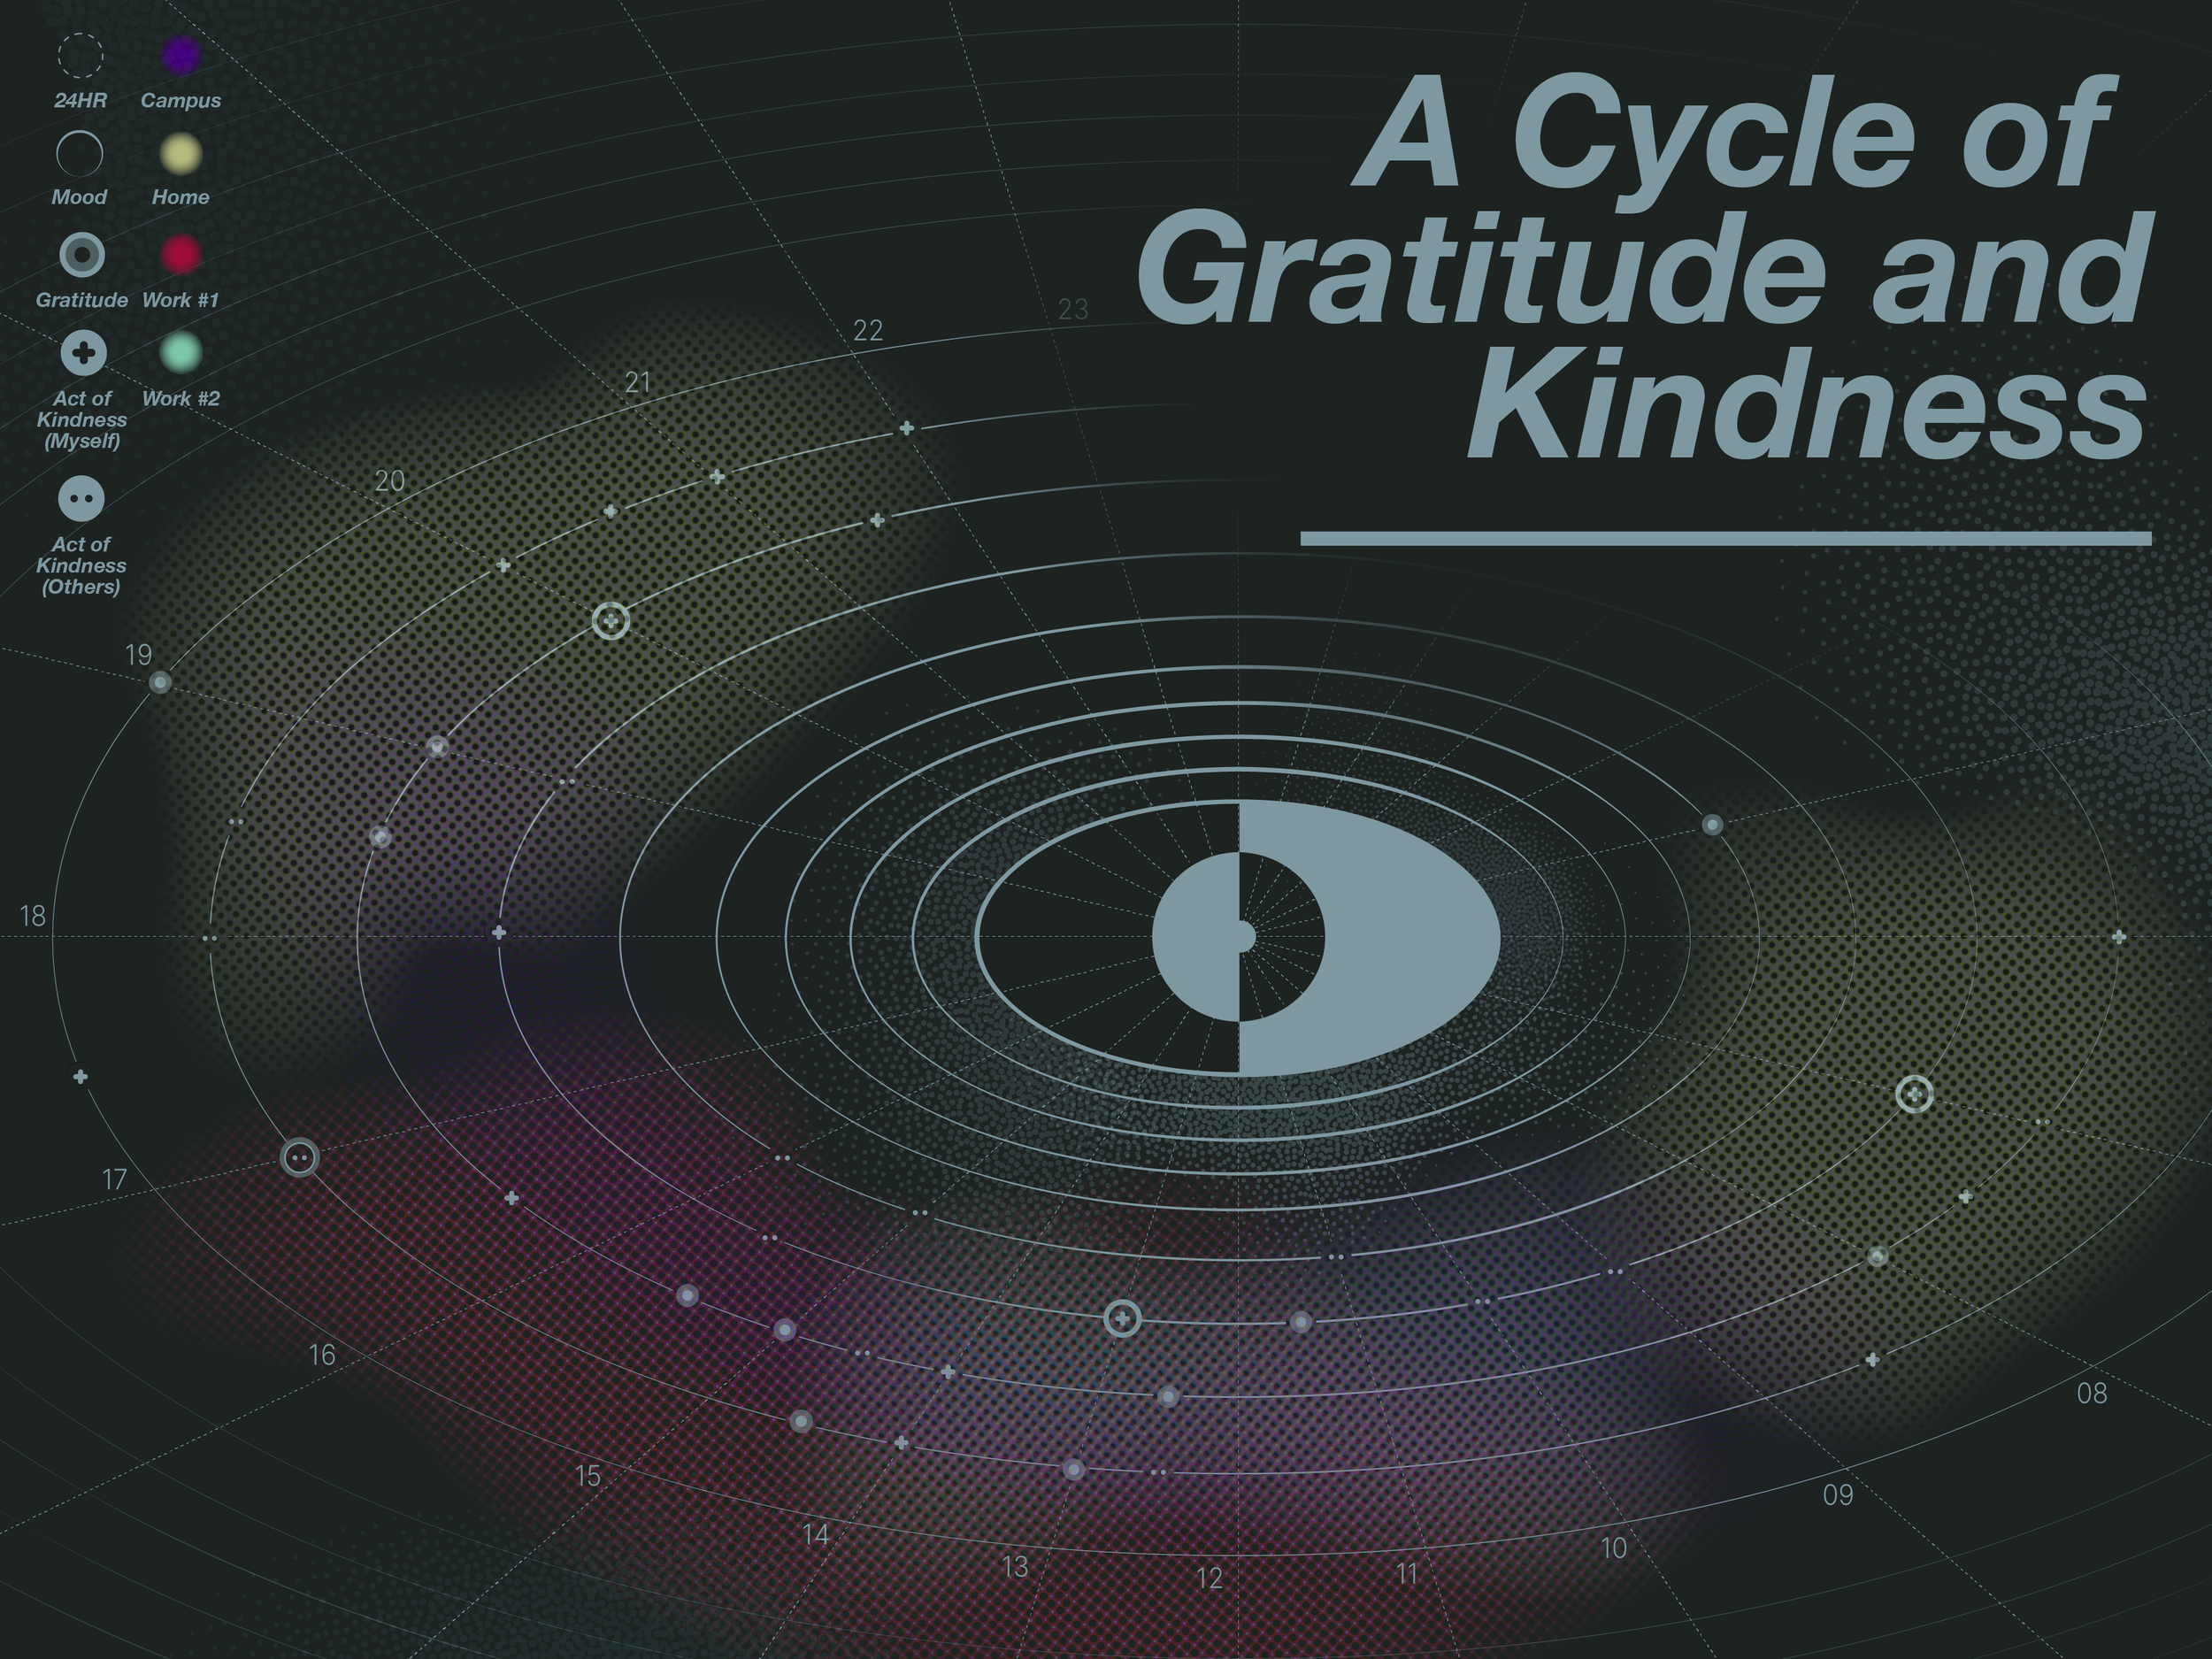
To make the data easier to read, activity times have been increased by 30 minutes for clarity.
Each symbol stands for a different activity, showing when and where it happened. This design helps us understand the flow of gratitude and kindness in daily life.
The main parts shown are: Time (24 hours), Mood, Gratitude, Kindness done by me, and Kindness done by others. Colors mark locations: Campus, Home, Work #1, and Work #2.
The sun stands for Gratitude, the cross for Kindness I gave myself, and two circles together for Kindness between two people. The symbols are simple and abstract to fit the graphic smoothly.
Reflection
I faced many challenges in this project, but found ways to overcome them. I usually stick to one idea, which doesn’t always work. With feedback from my group, my professor, and more research, I found new directions to continue.
This difficult, long, but rewarding process taught me how to create clear visual data and think carefully about presenting information. I also learned useful skills like using Excel and Miro to manage and analyze data better. I originally planned an interactive data visualization and hope to develop it further.
I enjoy working with complex problems and, despite some frustration, I like finding solutions that fit my style.